WeatherRidge

The ridge is building.

Turning weather data into decisions: what to do, where, and when to go.

WeatherRidge

What should I do this weekend?

Hike, bike, garden, climb, or stay inside? If you go, where? When should you leave?

Those are the questions that matter, and no weather app answers them easily. They show you numbers, mostly for cities: a temperature, a probability of rain, a wind speed. Then they leave you to decide whether 18 mph gusts ruin a paddle (they do), whether the smoke is too thick for a run, and whether Saturday morning beats Sunday afternoon.

WeatherRidge answers the question you actually asked. Tell it what you like to do and how you like to do it. It reads the latest forecast models, scores every place and every hour against your preferences, and shows you where and when conditions are best. Packing the car is still on you.

40activities, chilling included
10forecast models, who rarely agree
3ways to research: spot, route, region
10live layers, from radar to wildfire

Activity based

Every activity cares about different weather.

Planning a day outside used to mean opening five tabs. One spot forecast, a second model to check it against, the air quality map, the radar, and maybe a snow report. Then the hard part: filtering all of it, in your head, against the activity you had in mind, while someone asks whether you're going or not.

And every activity cares about something different.

  • Stand-up paddleboardinghates wind, gusts and cold. Swimming was not the plan.
  • Golfis ruined by wind and rain. Your slice is your own business.
  • Runningsuffers most from smoke and heat.
  • Cyclingcares which way the wind blows, and whether the roads are wet. Headwind both ways is not just a feeling.

Most apps solve this for one sport at a time and charge a premium for each. But people aren't single-activity. The same person skis in January, paddles in July and walks the dog every day. The dog has opinions about weather too. WeatherRidge is one tool for all of us.

Your activities, one menu
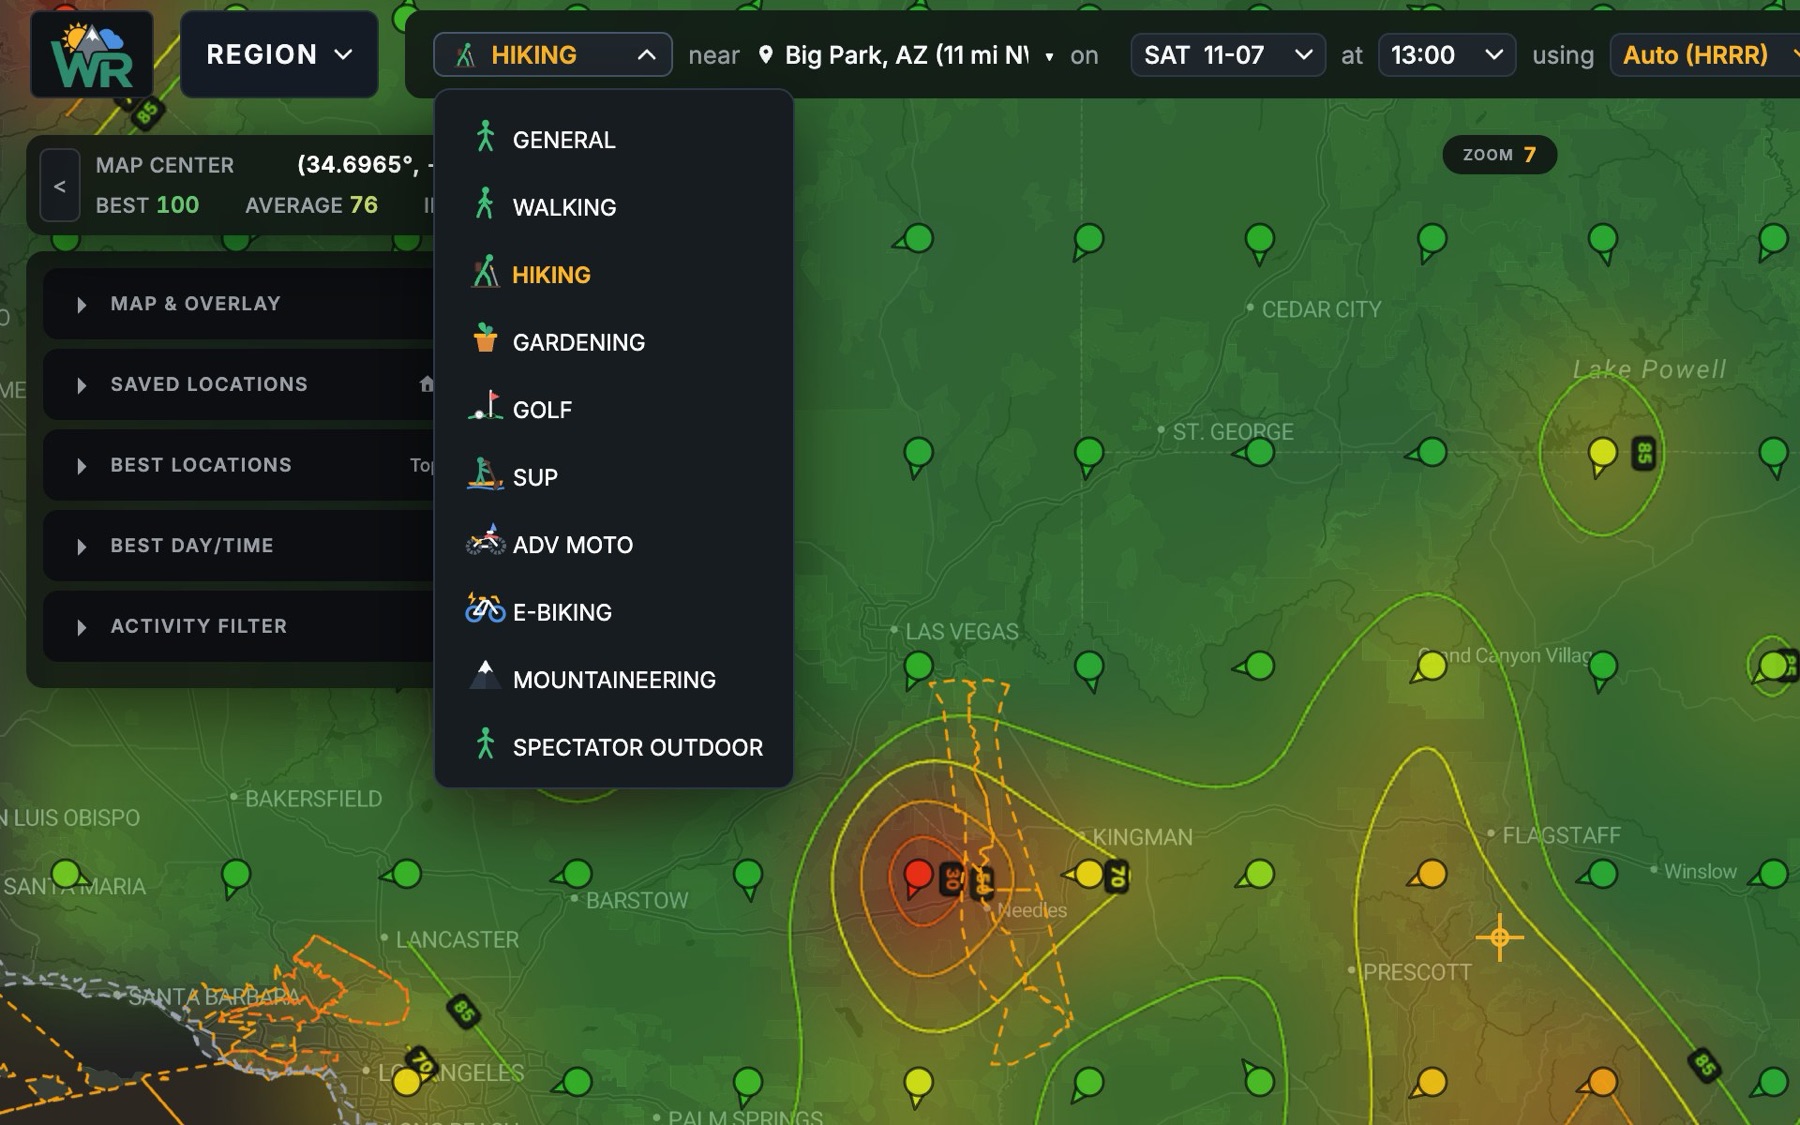
The activity menu open over the map, listing General, Walking, Hiking, Gardening, Golf, SUP, ADV Moto, E-Biking, Mountaineering and Spectator Outdoor.

Customized activities

40 activities, each with its own thresholds.

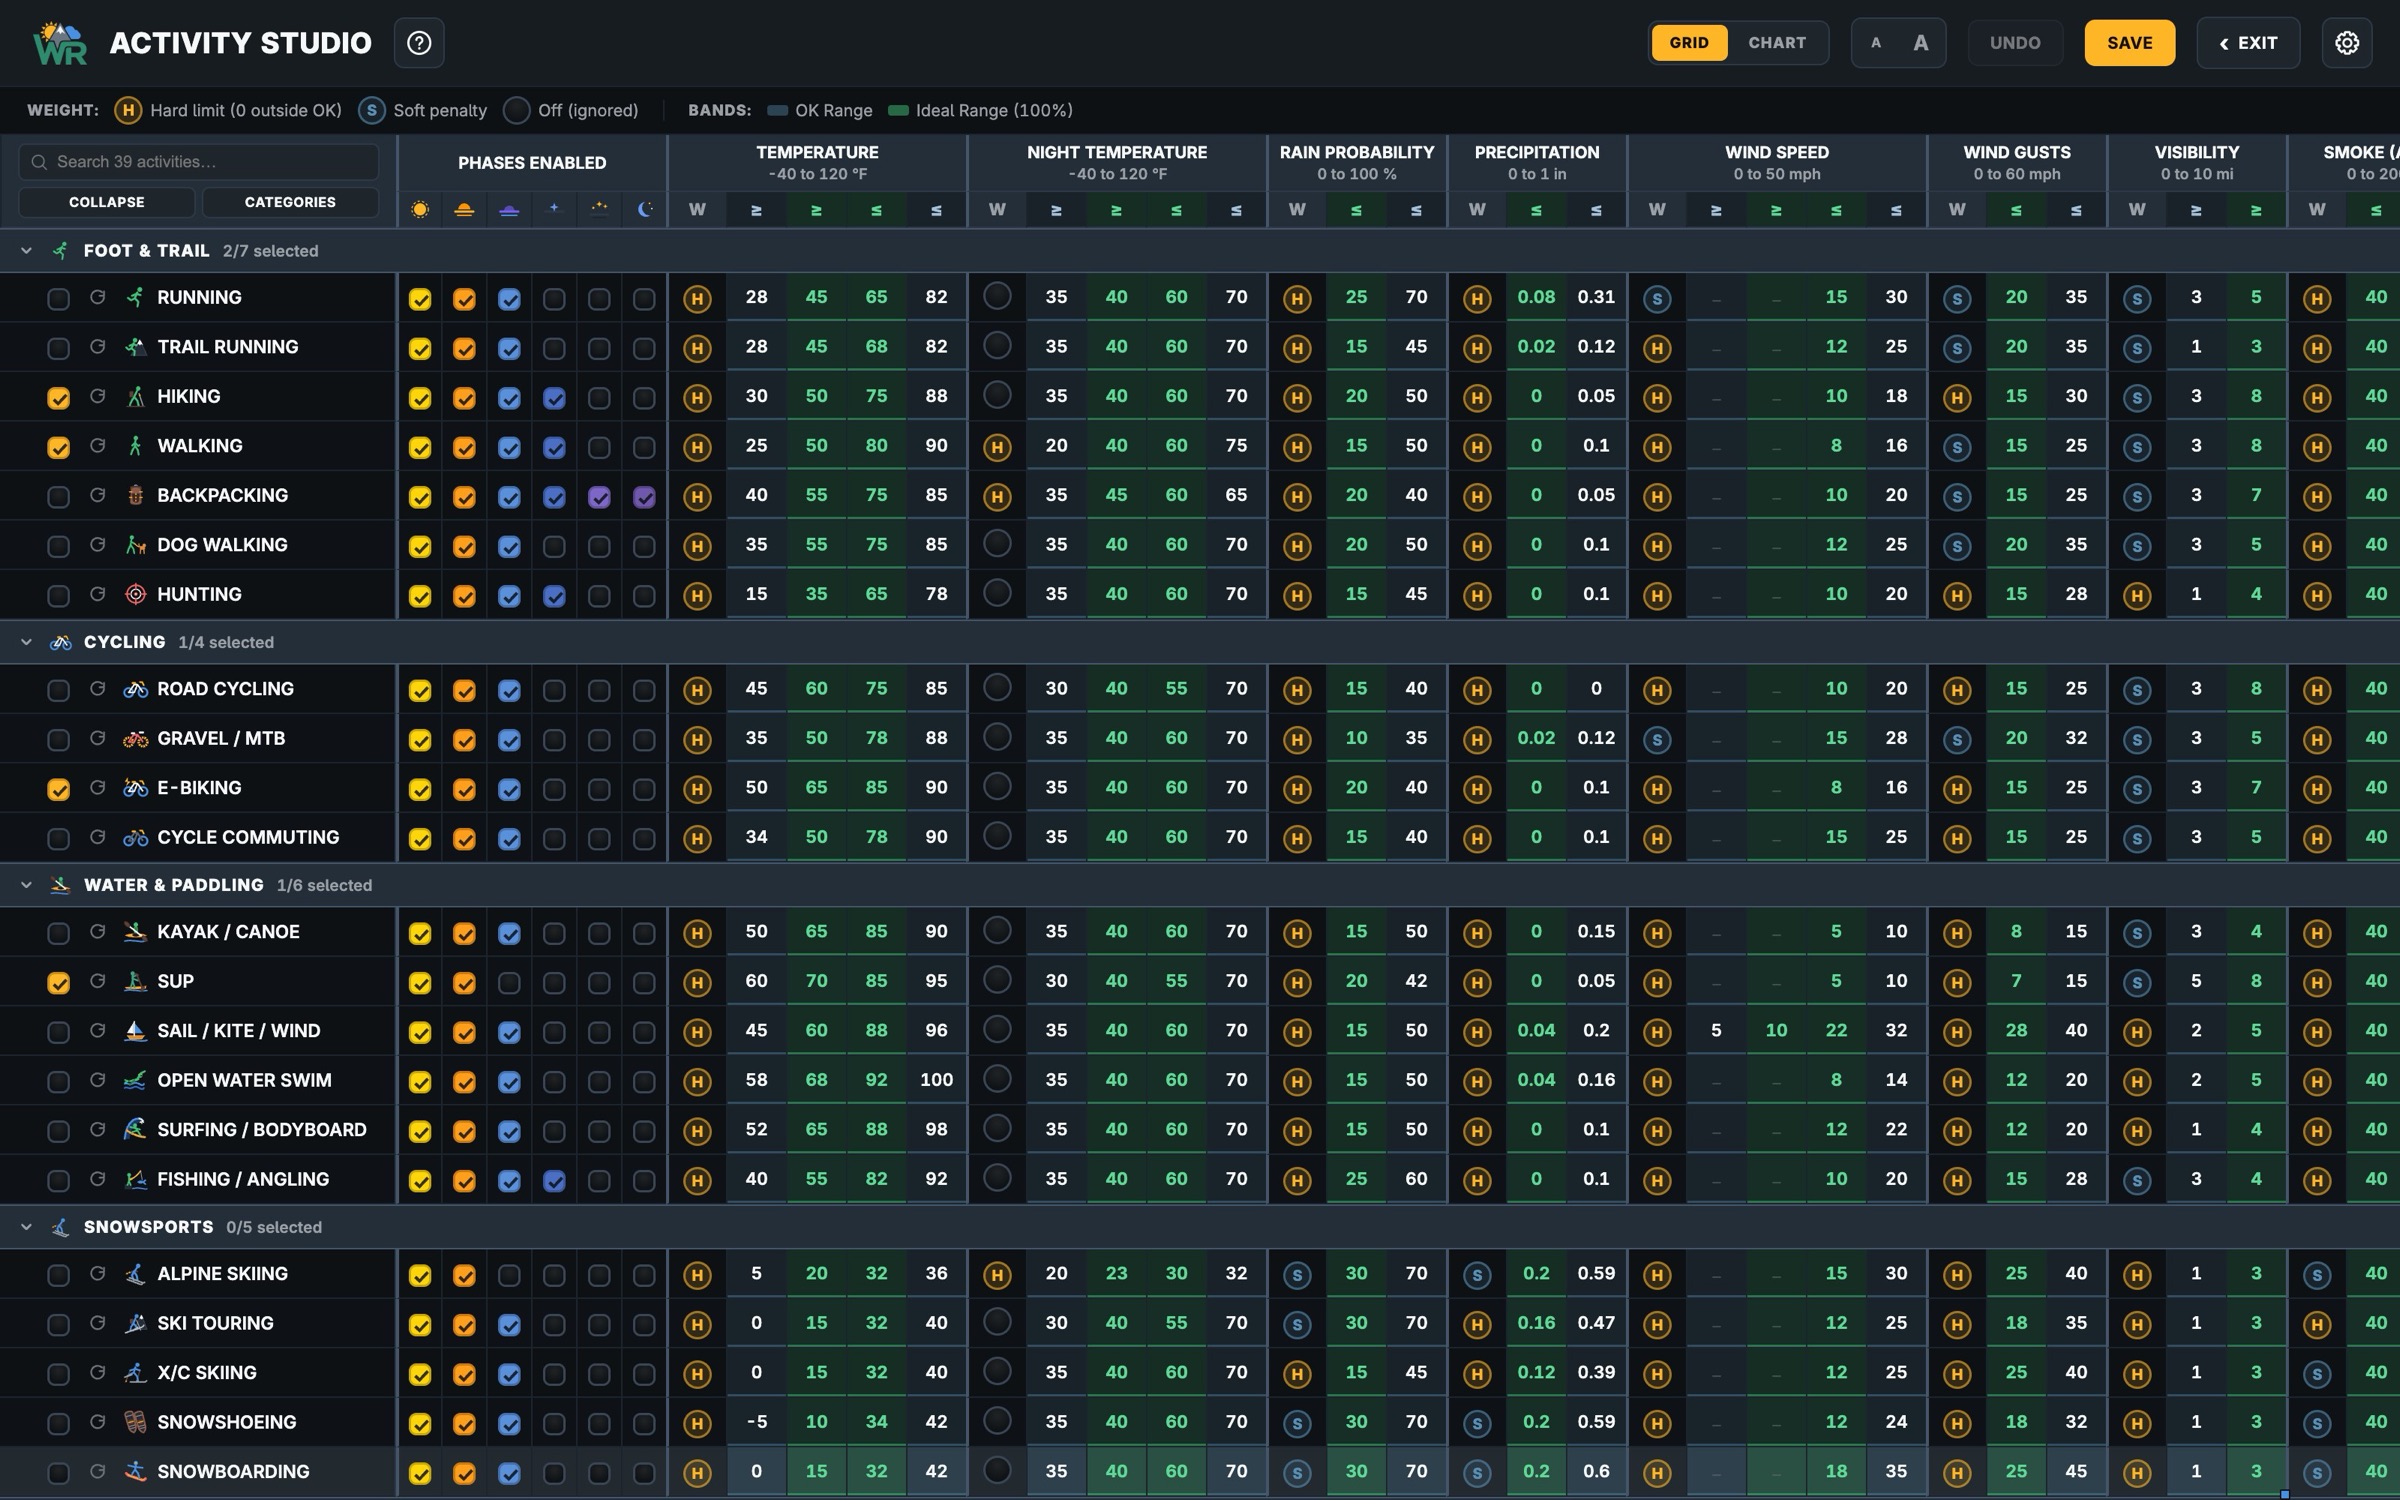
WeatherRidge ships with 40 activities across nine families. Each starts with sensible defaults for every weather factor: temperature, wind, gusts, rain probability, humidity, cloud cover, visibility, UV and air quality. Each factor has an ideal range and a tolerable one. The defaults are a good start. Your joints may disagree, so change them.

  • On foot
  • Cycling
  • Winter
  • Water
  • Mountain
  • Powersports
  • Field sports
  • Backyard
  • Camping and night sky
Activity Studio · grid The Activity Studio: a spreadsheet with every activity as a row and each weather factor's ideal and tolerable thresholds as columns, grouped by family.

Make any factor yours

Off

It doesn't matter to you. Clouds? Whatever.

Soft

Conditions fade gently from ideal to tolerable.

Hard

A deal-breaker. Breach it and that place drops to the bottom, however good everything else is. A 40 mph gust doesn't get partial credit.

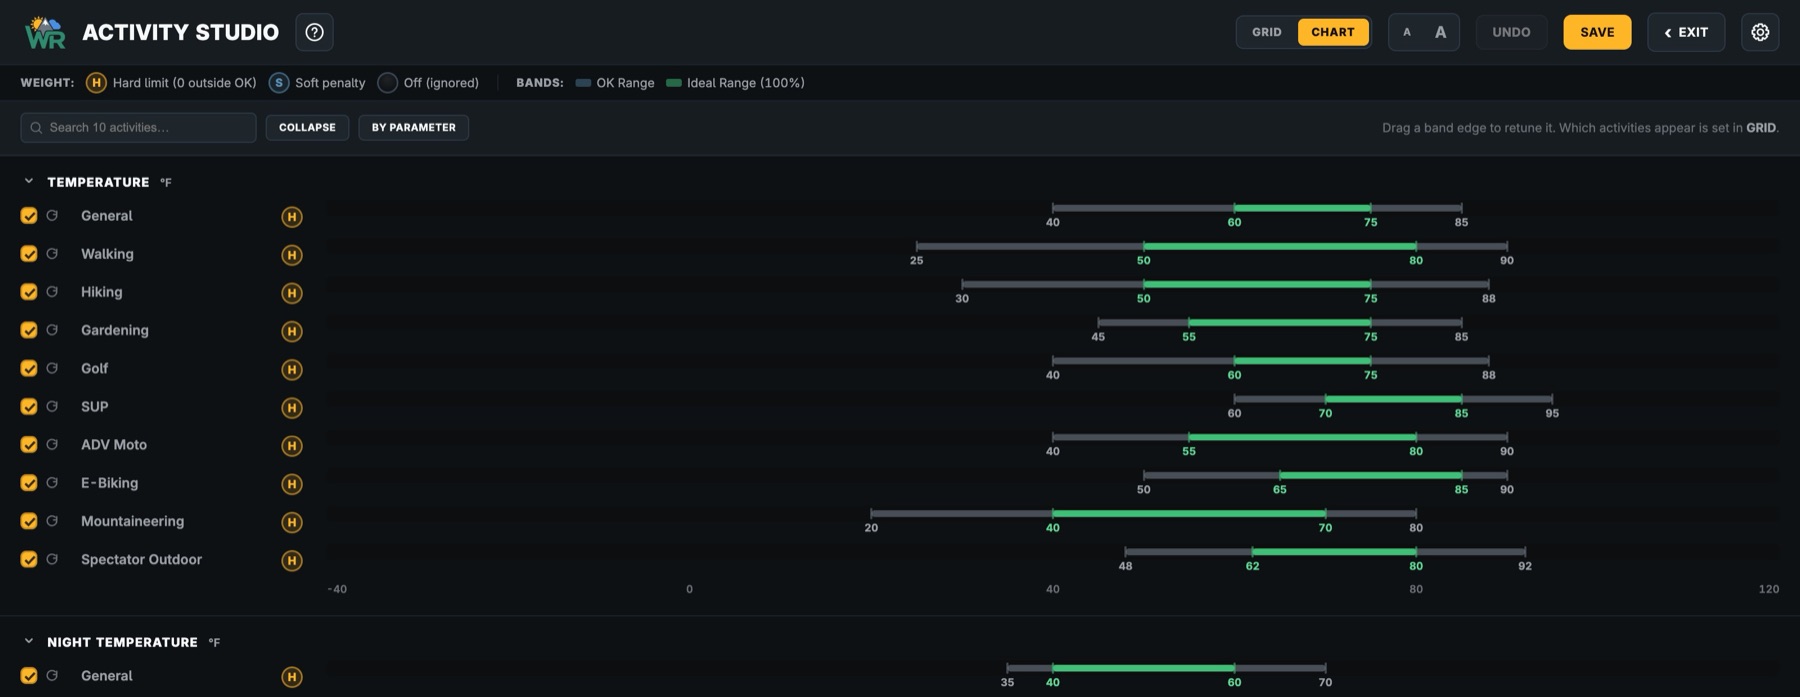
Tune every activity at once in the Activity Studio, a dashboard of every threshold, or drag the bands directly on its chart view.

Studio · chart The Studio's chart view comparing the temperature bands of ten activities on one shared axis, ideal ranges in green, each marked H for a hard limit.

The Condition Index

One score from 0 to 100, for every place and every hour.

Built from your own preferences, not someone else's idea of a nice day. Every map colour, route mark and day card reads from the same five bands.

0 to 29

Avoid

A deal-breaker is breached, or the weather is severe. Stay home. The couch might be the best option.

30 to 49

Poor

Multiple conditions outside your comfort range. Think twice, and possibly change the time or activity.

50 to 69

Marginal

Several conditions stray from your targets. Doable, if you're keen. Possible type 2 fun.

70 to 84

Good

Comfortable, with one or two factors near the edge. Bring a layer.

85 to 100

Ideal

Most or all of what matters lands inside your ideal window. Go! Why are you still reading?

Weather models

Choose the forecast model, or let Auto choose.

A forecast is only as good as the model behind it, and different models are good at different things. Other weather apps give you one model, sometimes proprietary and unnamed. WeatherRidge shows you which one you're looking at and lets you choose. A second opinion, or a third.

Flip between them in a keystroke and watch the map change. When the models agree, you can trust the forecast. When they don't, you know to keep an eye on it, and to pack the rain shell. Remember, forecasts are just computer models of what might happen. If in doubt, go on out!

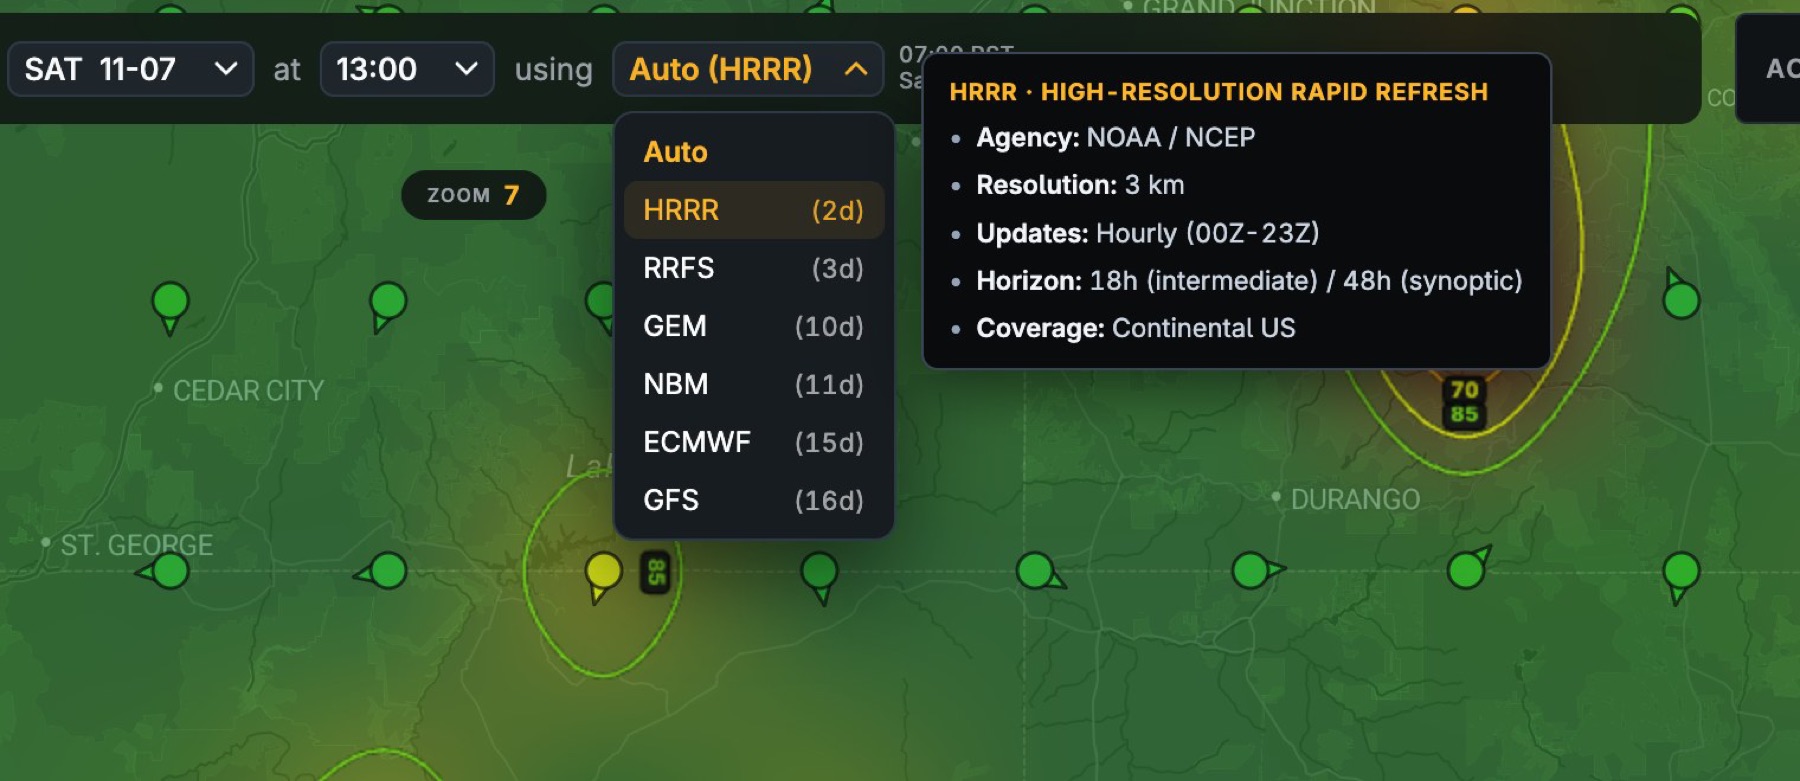
Hover any model The model menu open with Auto, HRRR, RRFS, GEM, NBM, ECMWF and GFS, and HRRR's card: NOAA, 3 km resolution, hourly updates, 48-hour horizon, continental US.

Auto

Picks the best model for where and when you're looking: HRRR's 3 km detail for the next two days in the US, NOAA's NBM blend after that, HRDPS in Canada, AROME and ICON in Europe, and ECMWF everywhere else.

Pick one yourself

From ten: HRRR, NBM, RRFS, HRDPS, AROME, ICON-D2, ICON-EU, ECMWF, GFS and GEM. Hover any of them for its resolution, update cycle, horizon and coverage.

Blend

Combines the three global models, ECMWF, GFS and GEM, weighting each by how far ahead you're looking. Shows you the agreement, or lack thereof, between the major long-range models.

Always the latest run. Each model is refreshed on its agency's own official schedule. WeatherRidge knows when each next run lands, so the moment NOAA, Environment Canada, Météo-France, DWD or ECMWF publish a new forecast, yours is marked out of date, and with Autoload on it refreshes the next time you come back to the tab. HRRR runs every hour and does not take weekends off. You're never planning on yesterday's numbers, and the model chip always shows how fresh the run you're looking at is.

The ten forecast models and their official update cycles
ModelAgencyDetailNew runLooks aheadCovers
HRRRNOAA3 kmEvery hour48 hContinental US
NBMNOAA / NWS2.5 kmEvery hour11 daysContinental US
RRFSNOAA3 kmEvery 6 hours3.5 daysContinental US
HRDPSEnvironment Canada2.5 kmEvery 6 hours3 daysCanada and US
AROMEMétéo-France1.3 kmEvery 3 hours2 daysFrance and Western Europe
ICON-D2DWD2.2 kmEvery 3 hours2 daysCentral Europe
ICON-EUDWD7 kmEvery 6 hours5 daysEurope
ECMWFECMWF25 kmTwice a day15 daysGlobal
GFSNOAA13 to 25 kmEvery 6 hours16 daysGlobal
GEMEnvironment Canada15 kmTwice a day10 daysGlobal

Three modes

View a full REGION, a specific ROUTE, or saved favorite locations in SPOT mode.

Region

Where should I go?

In Region mode, pan the map over everywhere you'd be willing to drive. (Be honest.) WeatherRidge scores a grid of points across the whole view and paints the result as a continuous wash: green where conditions suit your activity, red where they don't. Score contours trace the edges like elevation lines on a topo map.

The Best Locations rail lists the top spots by name. Step through the hours and days and watch the good weather move.
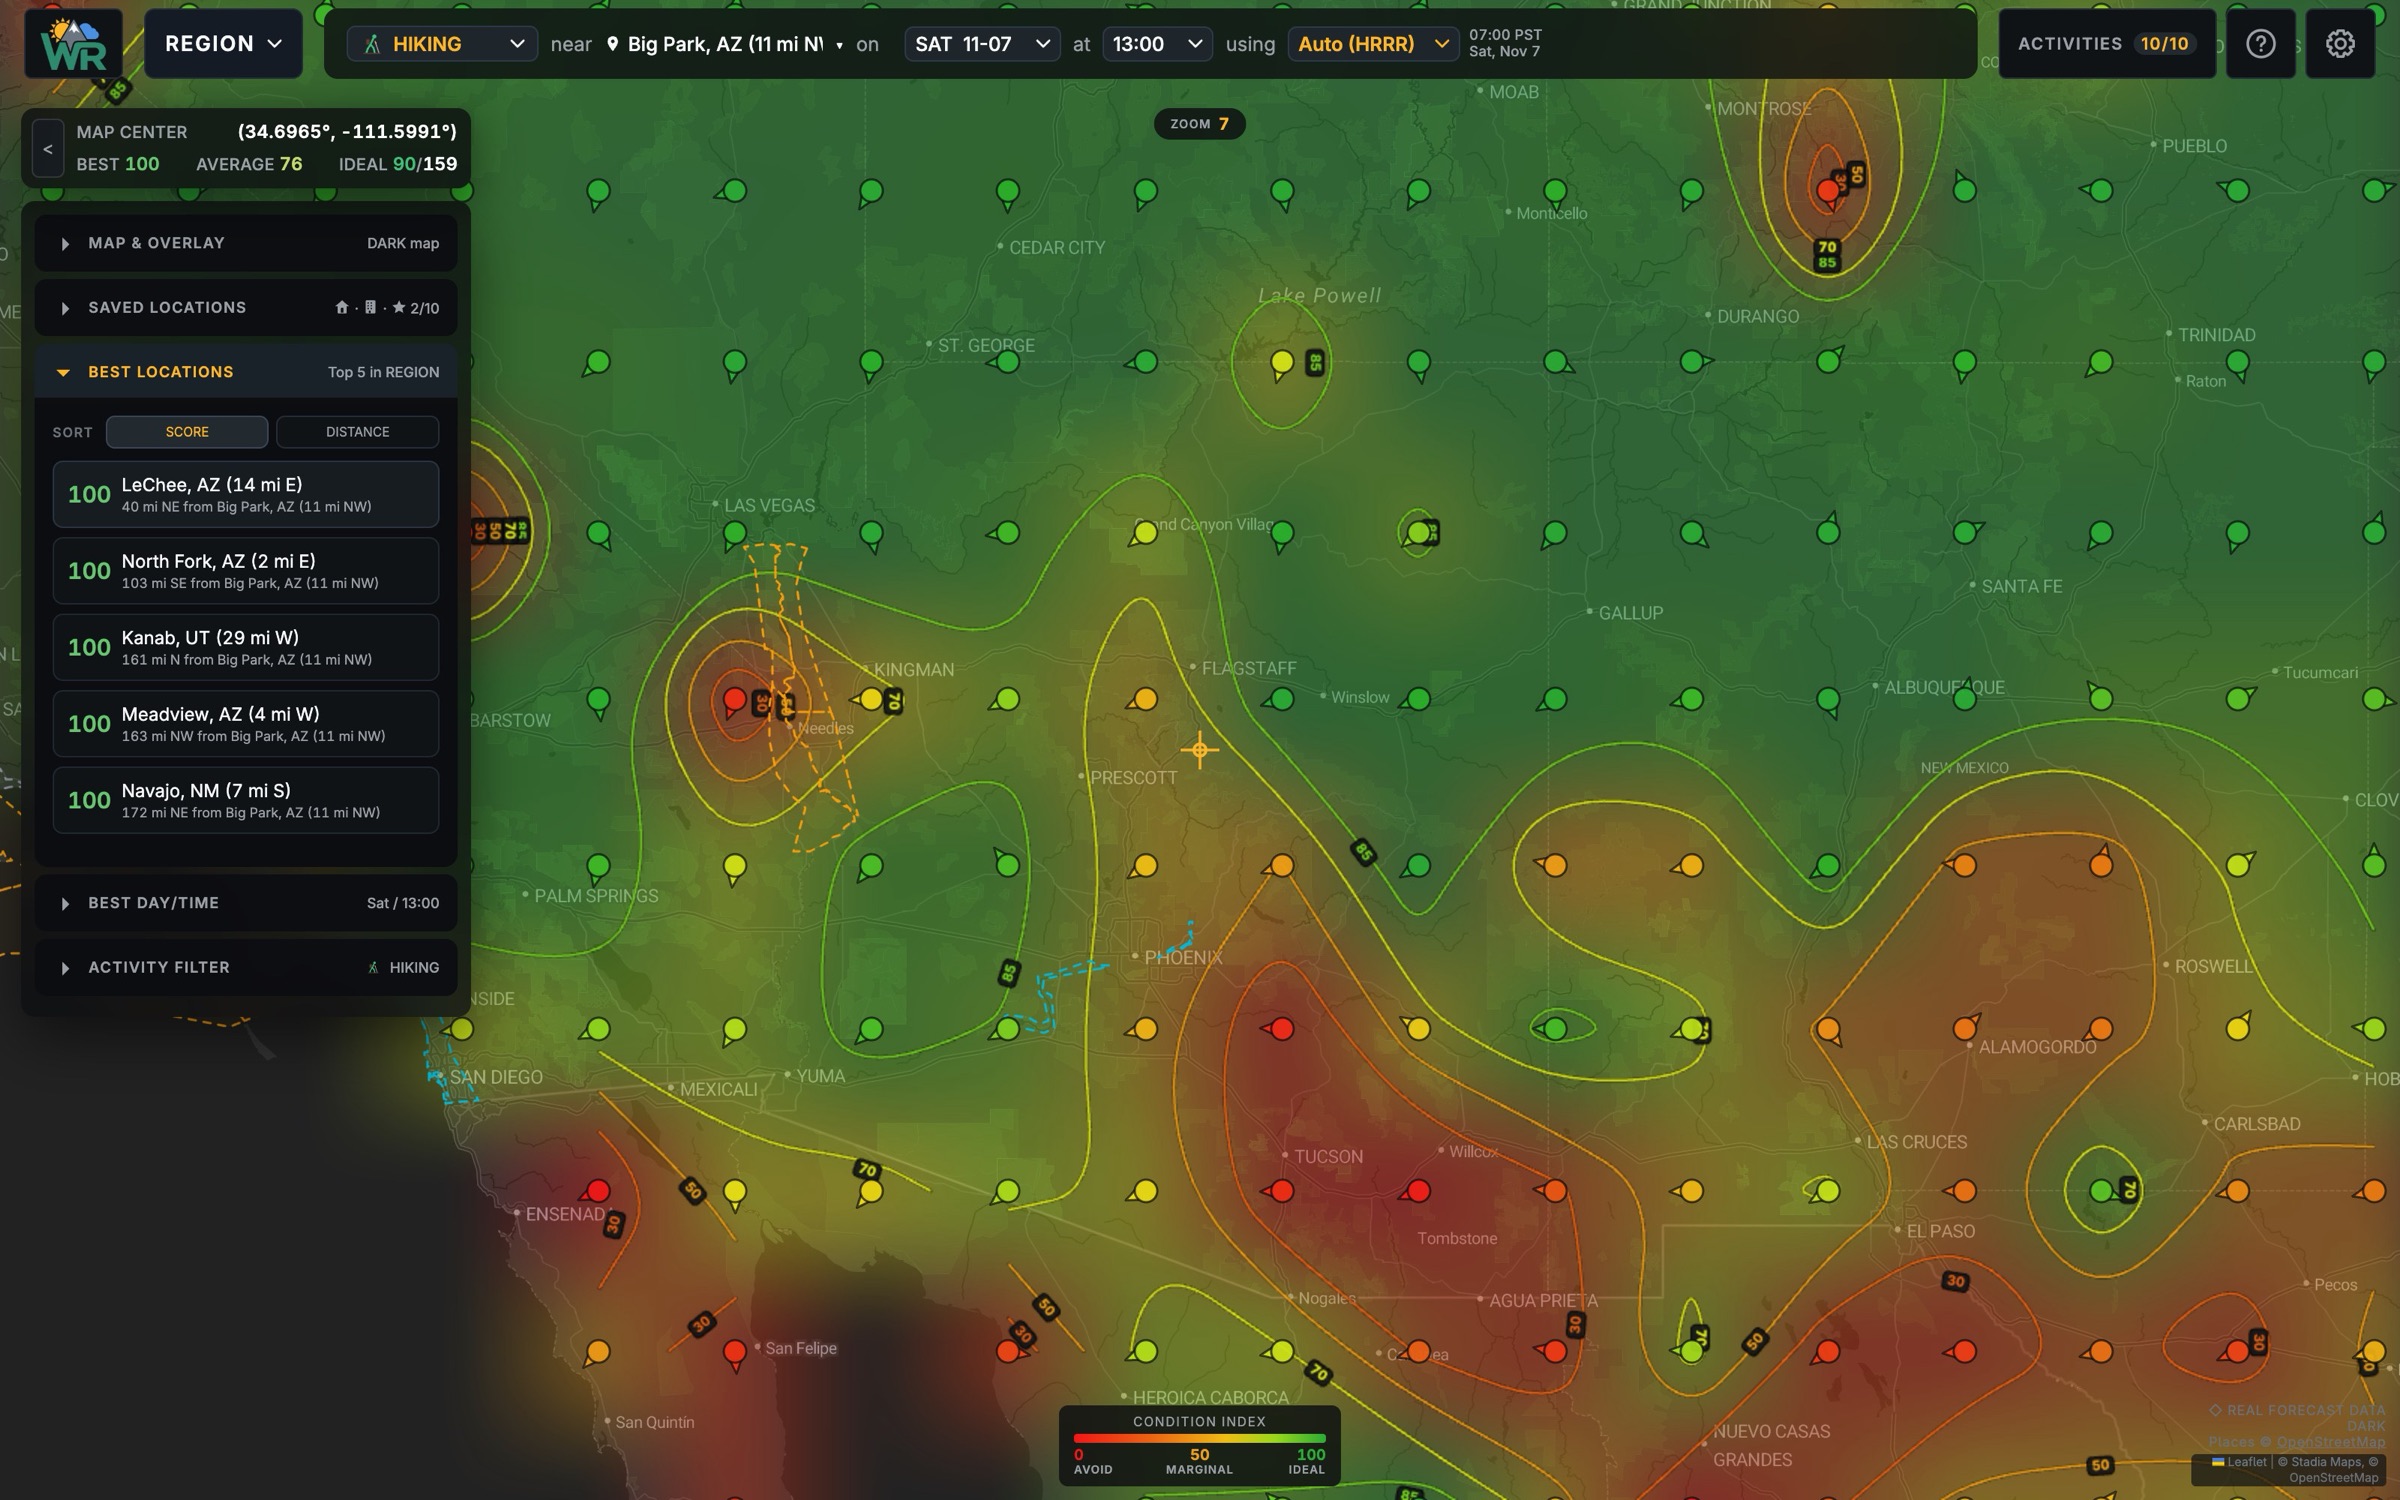
Best locations · hiking
Close view of REGION: the Best Locations list ranks LeChee, North Fork, Kanab, Meadview and Navajo at 100 for hiking.

Route

How will this trip feel, and when should I leave?

In Route mode, drop in the GPX from the route you planned in Gaia, CalTopo, Garmin Connect, RideWithGPS, Strava or anywhere else, and keep it in one of three libraries.

Favorites

The routes you do all the time: the daily run, the bike commute, the morning paddle, the evening dog walk. Check this week's best window for each in seconds.

Bucket List

The big trips you're waiting to do someday, when the timing and the weather finally line up. Keep an eye on them and pounce when they turn green. Someday turns out to be this weekend.

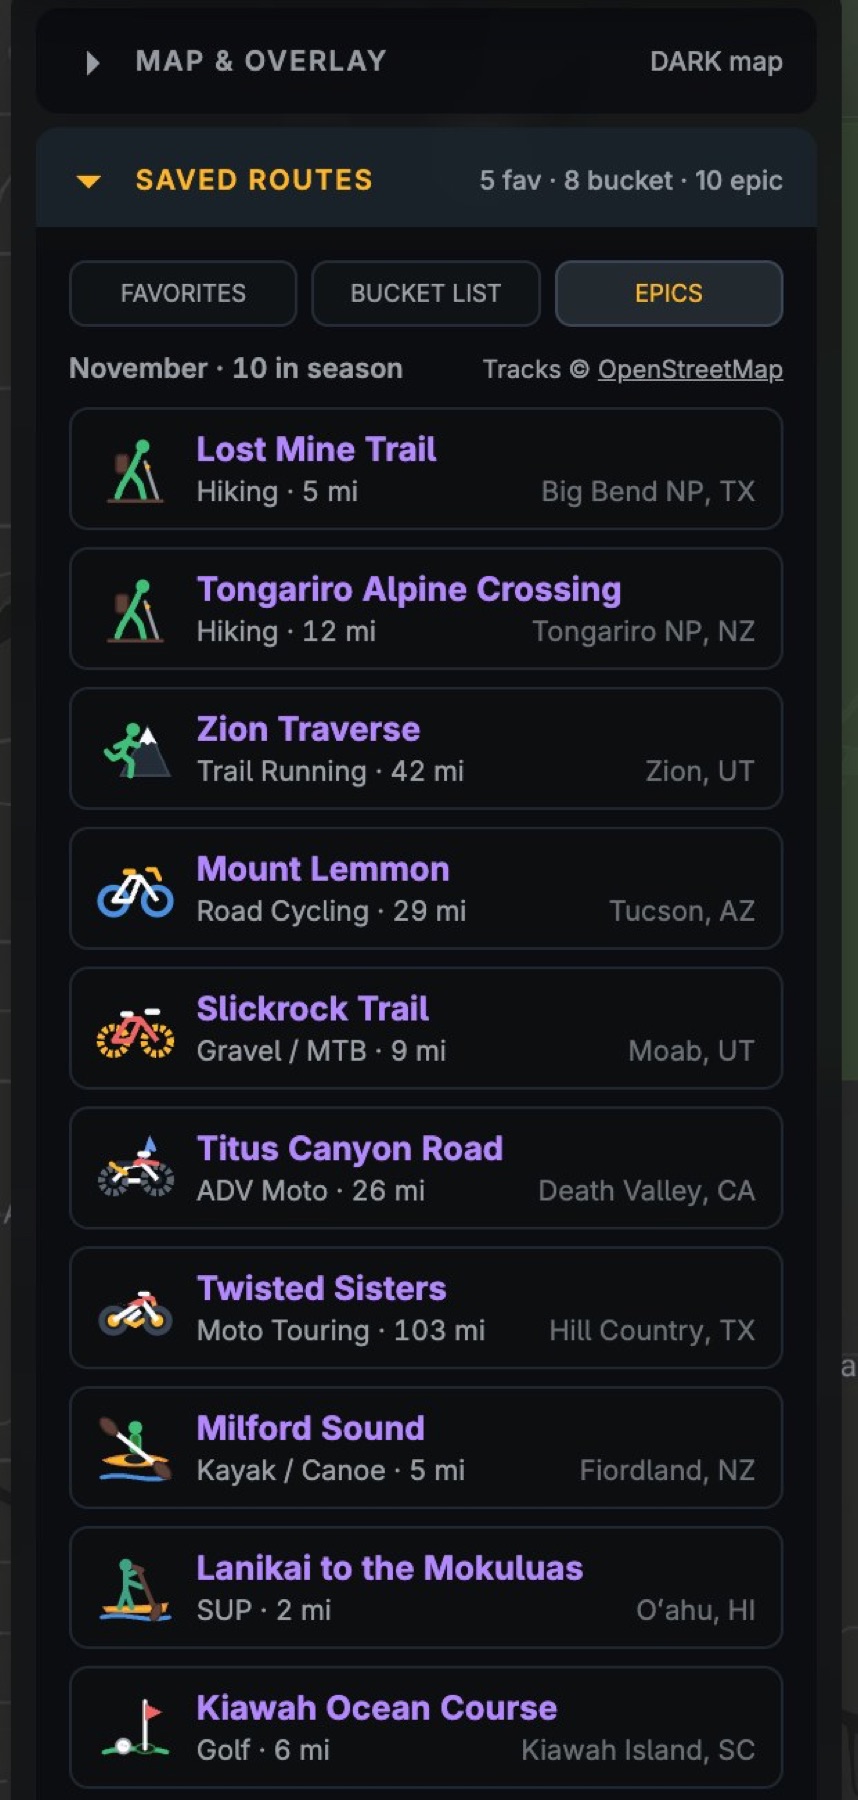
Epics

Iconic routes from around the world that are in season right now, picked by WeatherRidge and refreshed every month. Load one with just a click, for inspiration or for next weekend. YOLO.

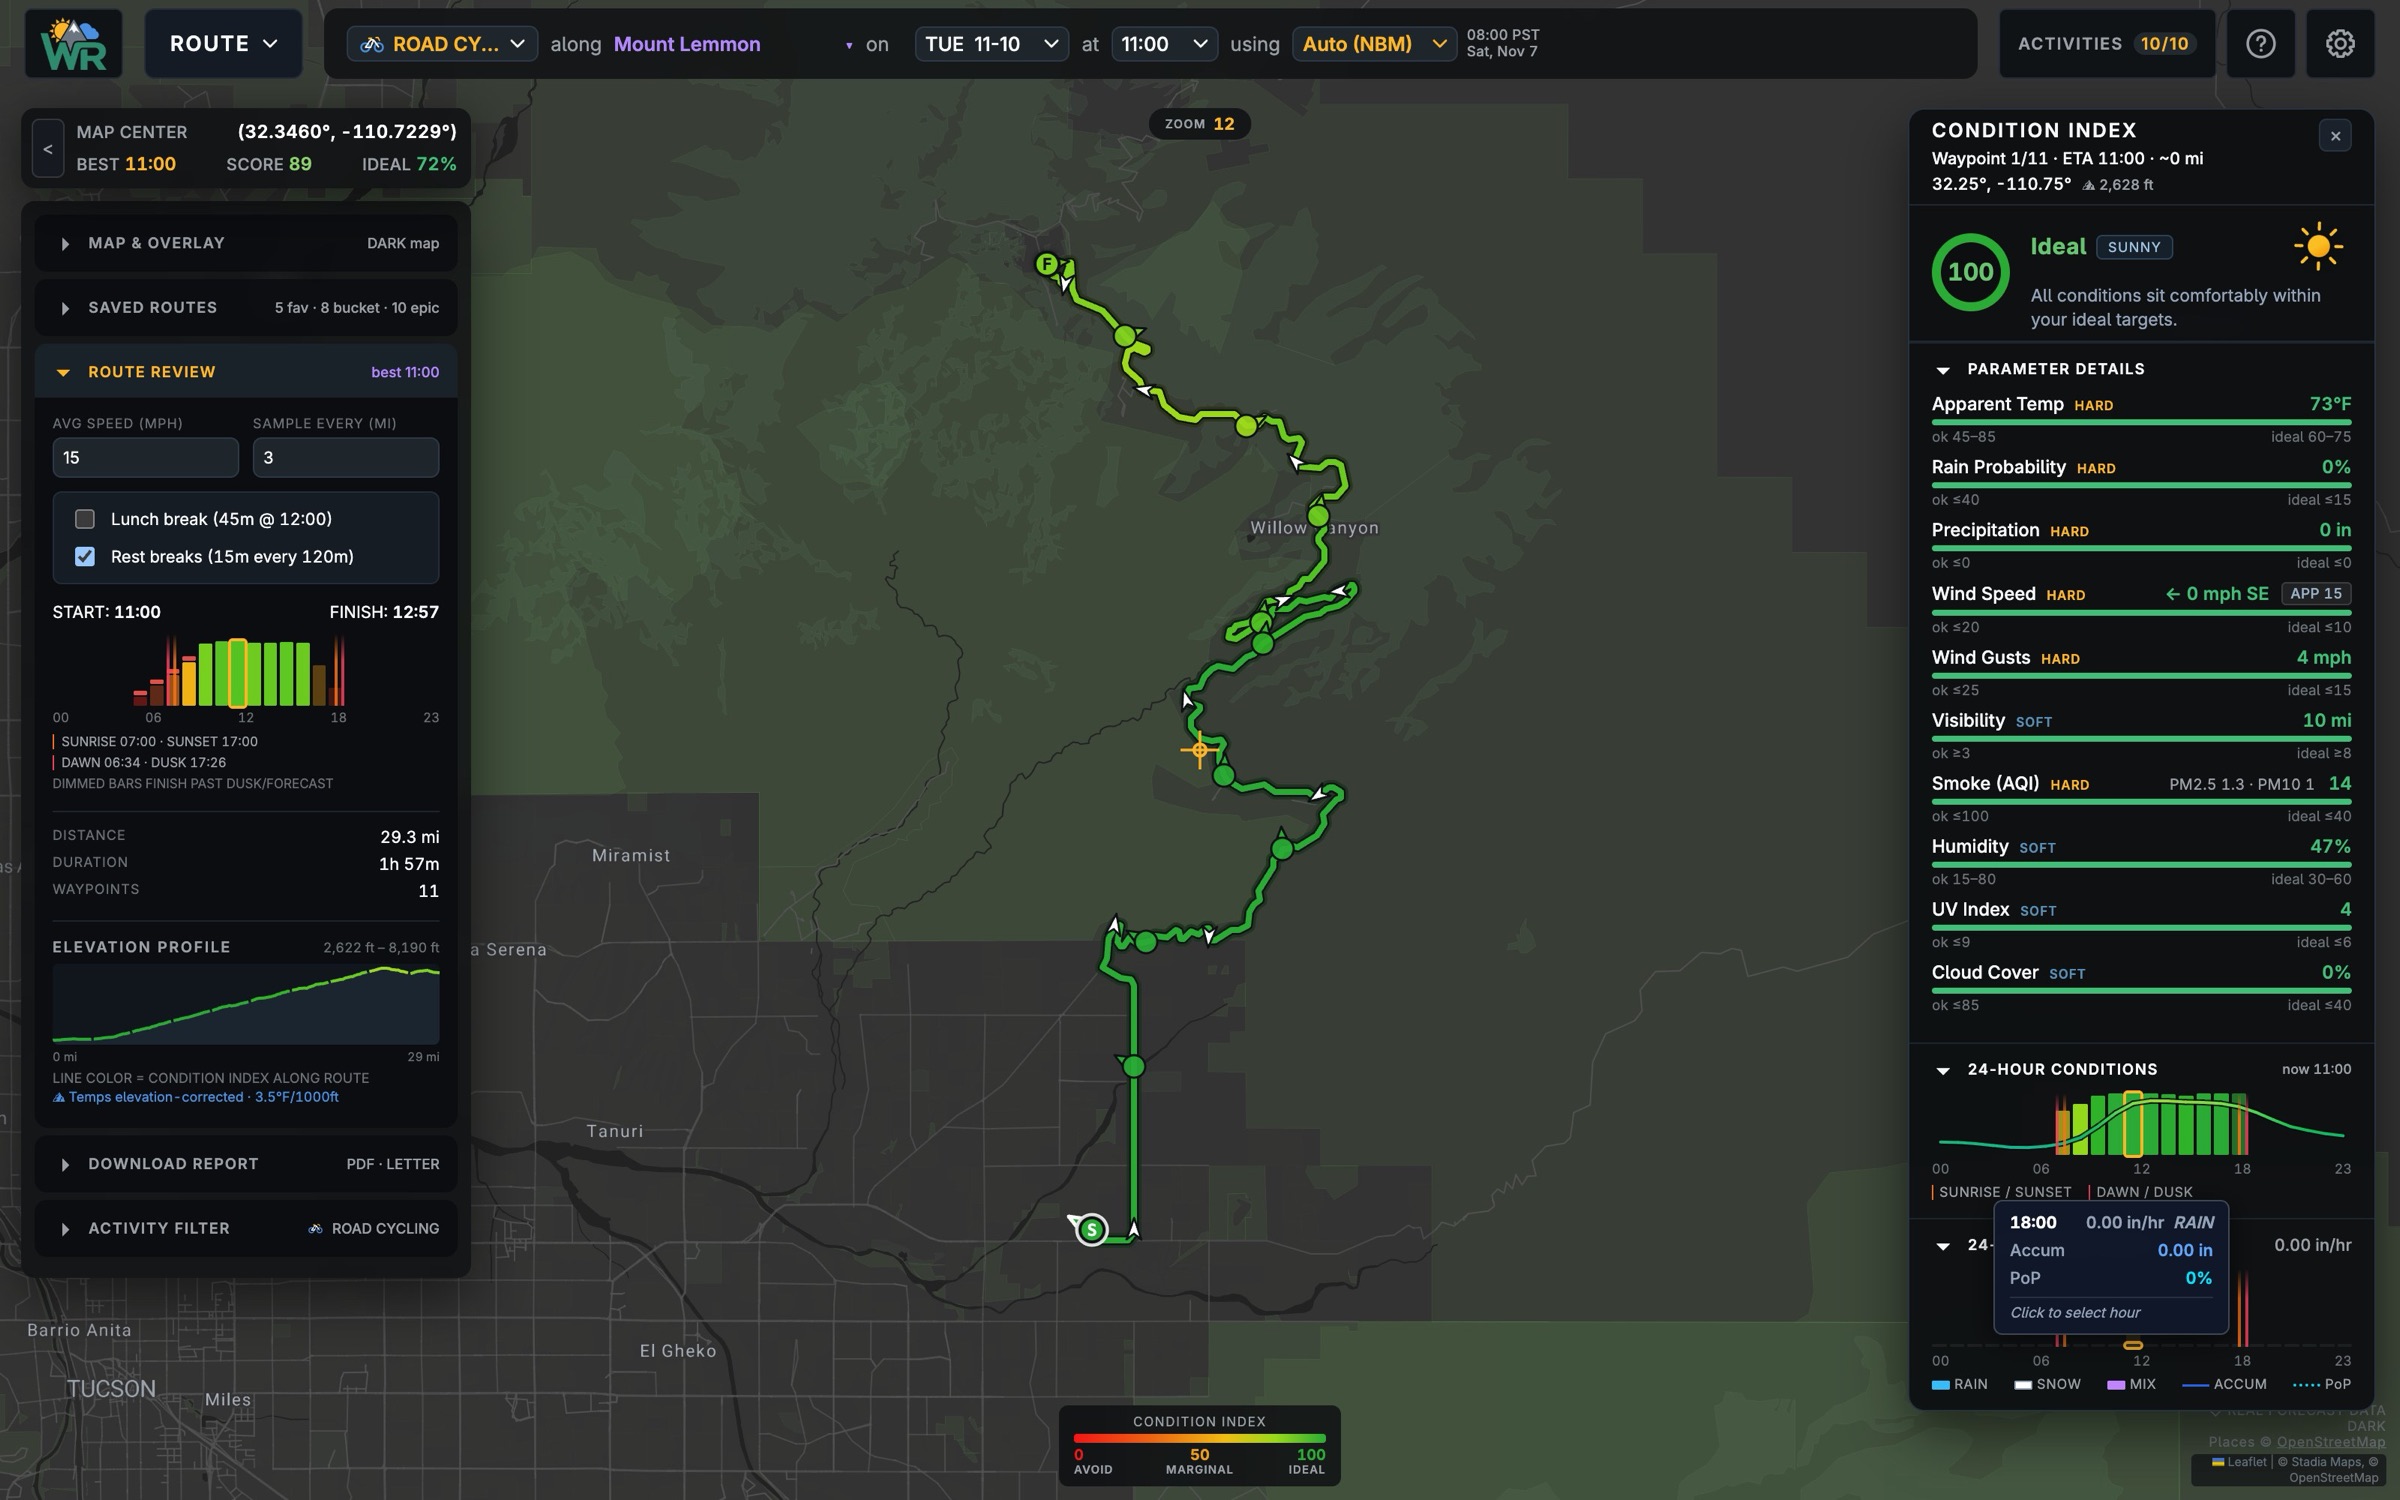
Mount Lemmon · Tue 11:00 · score 89 ROUTE view of the Mount Lemmon climb near Tucson, coloured green along its length, with a departure strip, the elevation profile, and a waypoint scoring Ideal.
Epics · November The Epics library for November, led by Lost Mine Trail, Tongariro Alpine Crossing, Zion Traverse, Mount Lemmon and Slickrock Trail.

Whichever you load, WeatherRidge follows you along it at your set pace, reading the forecast for each stretch at the hour you'll actually be there, adjusted for elevation along the way.

  • One score for the trip, weighted by time spent in each condition, so a brief bad patch counts less than a long one.
  • A departure strip that scores every possible start time, so the best time to leave is plain to see.
  • Red marks on any hard limit you'd hit, even a short one. Fifteen minutes of downpour still counts.
  • A shareable PDF sheet and an interactive HTML report for your partners, with its own departure scrubber that works offline. Nobody gets to say they weren't told.

Spot

What's coming up at the places I care about?

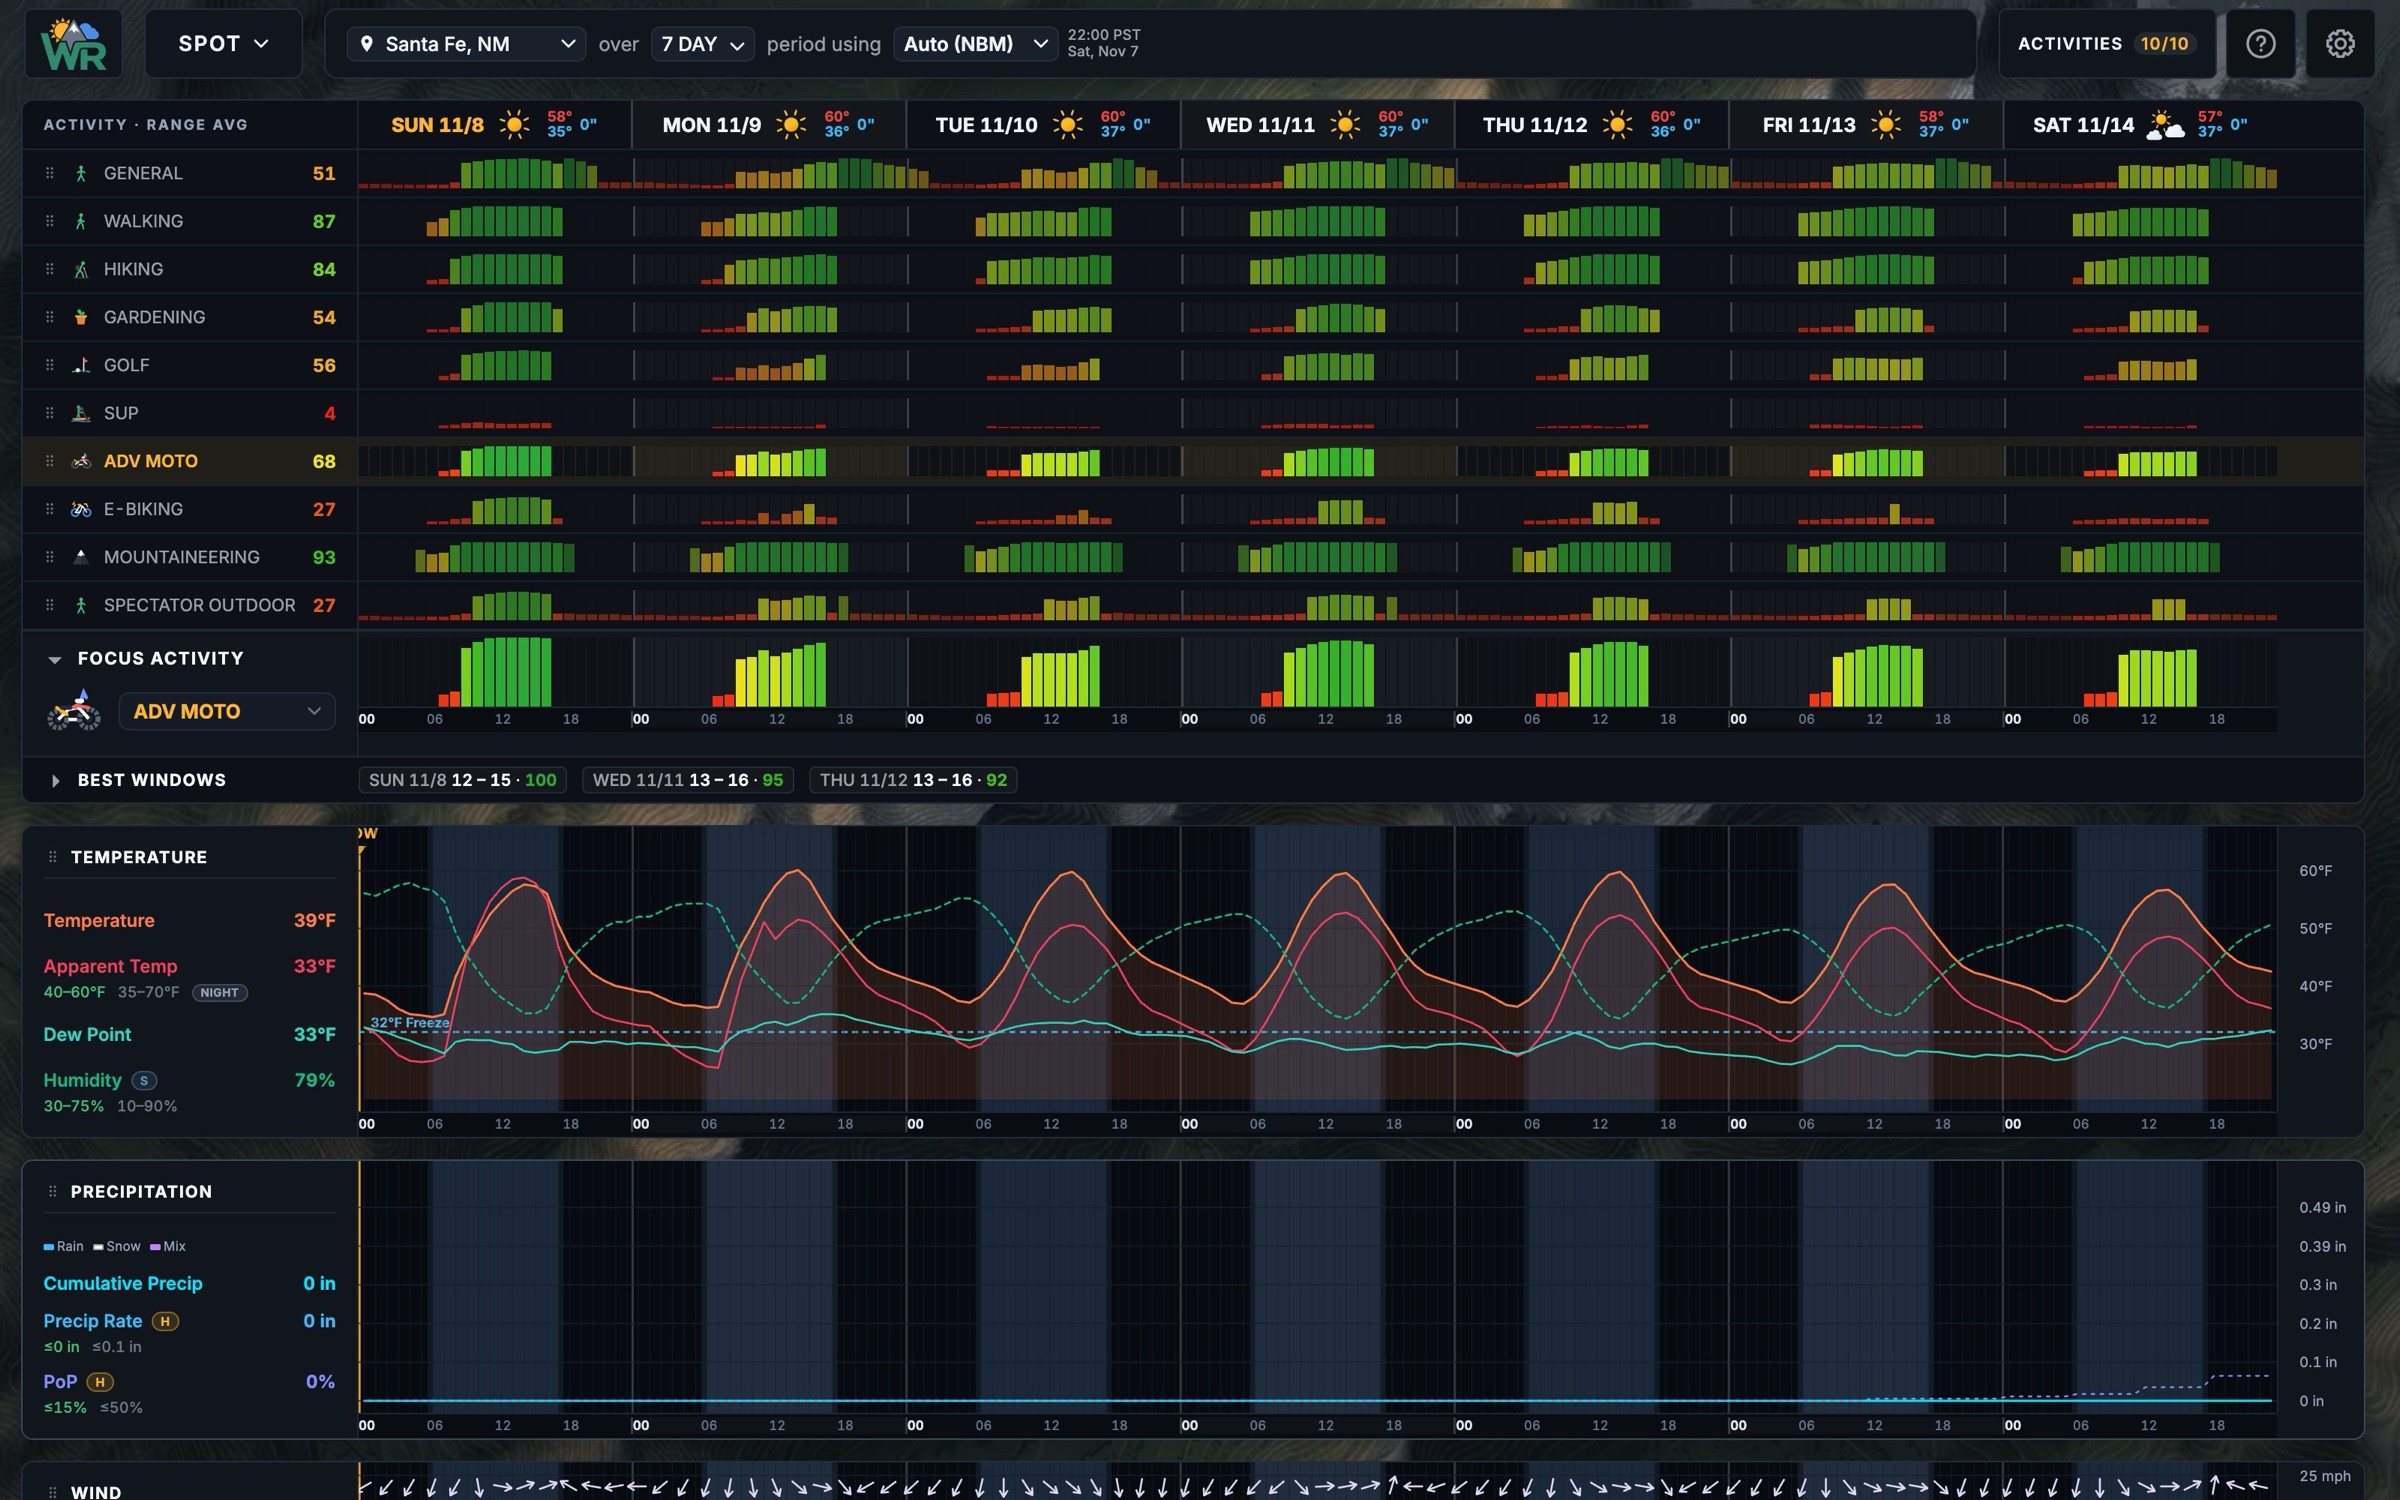
Pick a place: home, work, the trailhead, your VRBO rental, the local climbing crag. SPOT mode lays out every one of your activities against every day of the coming week or two, so you can see at a glance that Tuesday is a golf day, Thursday a ride and Saturday a hike. Work goes on whichever day is left. Open any day for the hour-by-hour detail: temperature, apparent temperature, wind and gusts, rain and snow, freezing level.

SPOT mode · Santa Fe, NM · 7 days SPOT mode for Santa Fe, New Mexico: ten activities scored hour by hour across seven days, from mountaineering in the 90s to SUP near zero, with best windows listed and temperature and precipitation charts below.

Numerous layers

A forecast is not the whole picture.

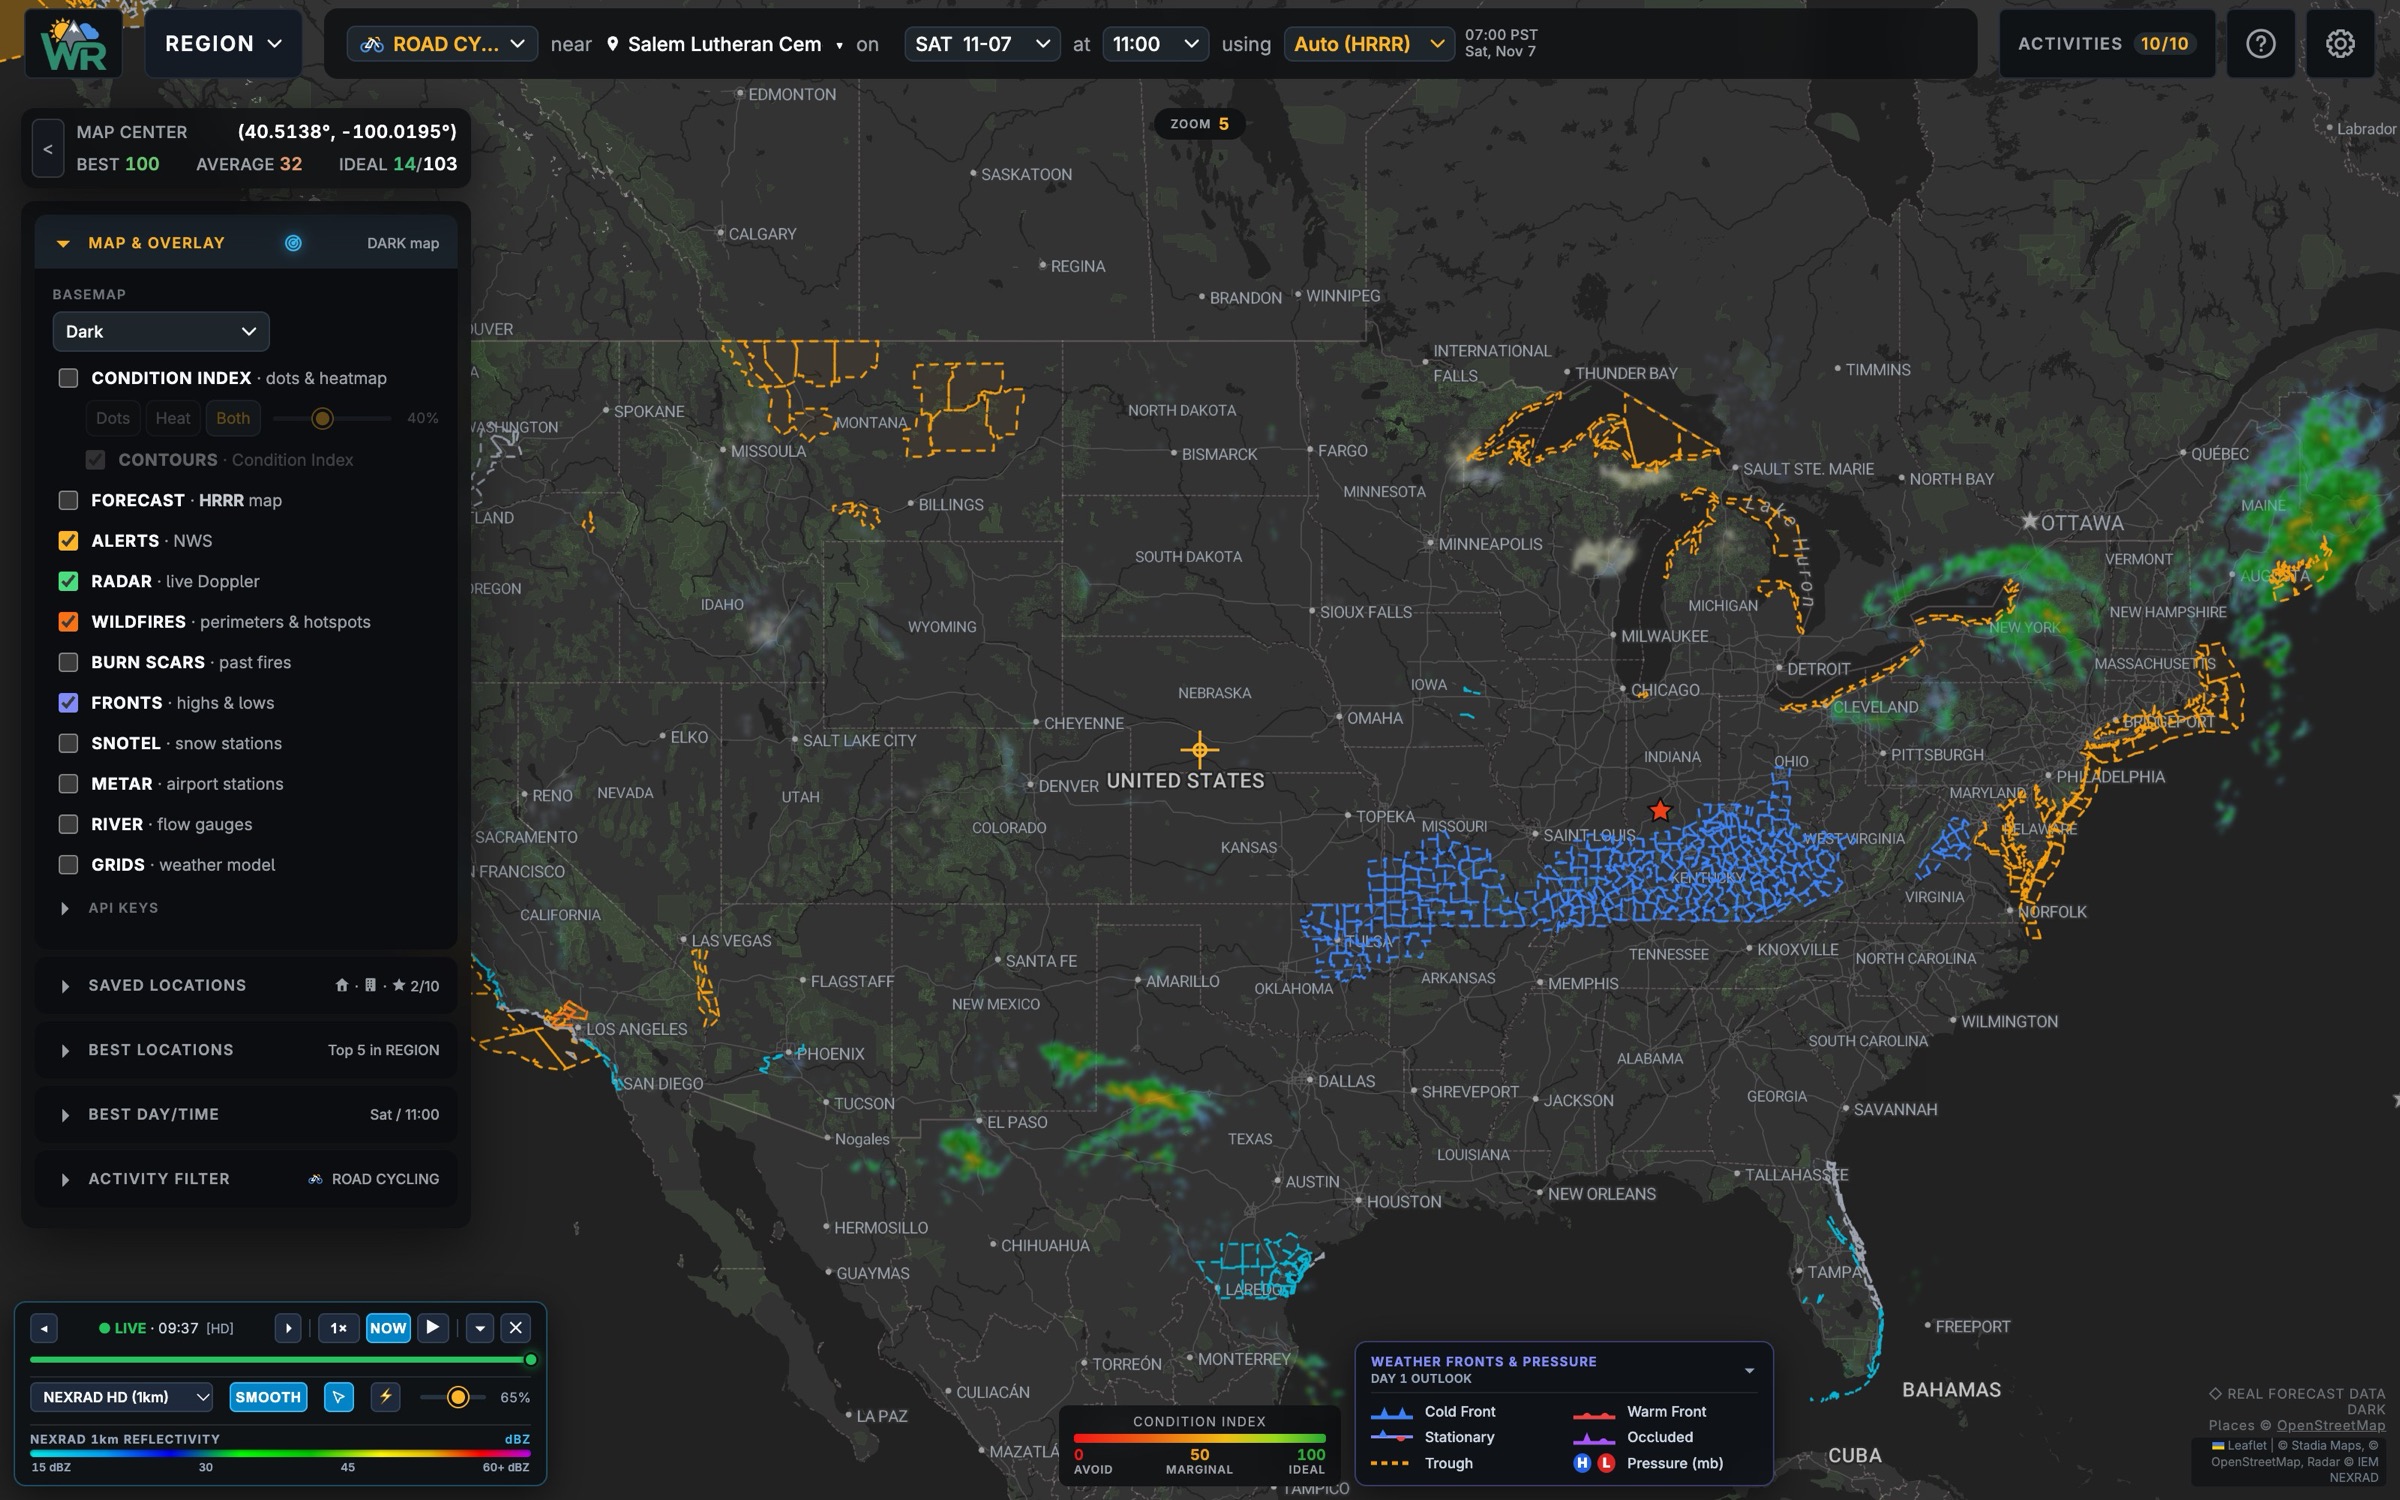
WeatherRidge stacks the other layers that decide a day outside right onto the same map, each one a toggle away. Turn on as many as you like.

Alerts · radar · wildfire · fronts The MAP and OVERLAY panel open over a national map showing NWS alert zones, live radar returns in the Northeast and Southwest, and the radar player.
  • Weather alerts. Active NWS watches, warnings and advisories, shaded where they apply.
  • Forecast overlay fields. Temperature, precipitation and snowfall totals and many more, drawn straight from the selected model.
  • Radar. Live precipitation, looped, with the intensity and predicted precipitation under your cursor.
  • Lightning. Live strikes, coloured by age.
  • Wildfire. Current fire perimeters and satellite hotspots, plus a warning if your route passes near one.
  • Burn scars. Up to 20 seasons of past fires, for the trails that may have changed.
  • Fronts. Cold, warm and stationary fronts and the highs and lows that drive them.
  • SNOTEL. Snow depth, snow water and the last 24 hours of change at mountain stations.
  • Airports. Live observations and flight conditions at every airport in the world.
  • Rivers. Flow, stage and flood levels from stream gauges.

In addition to your own Condition Index, WeatherRidge warns you about standard heat index and frostbite dangers.

Fast & interactive

Fast, and built for quick research and decisions.

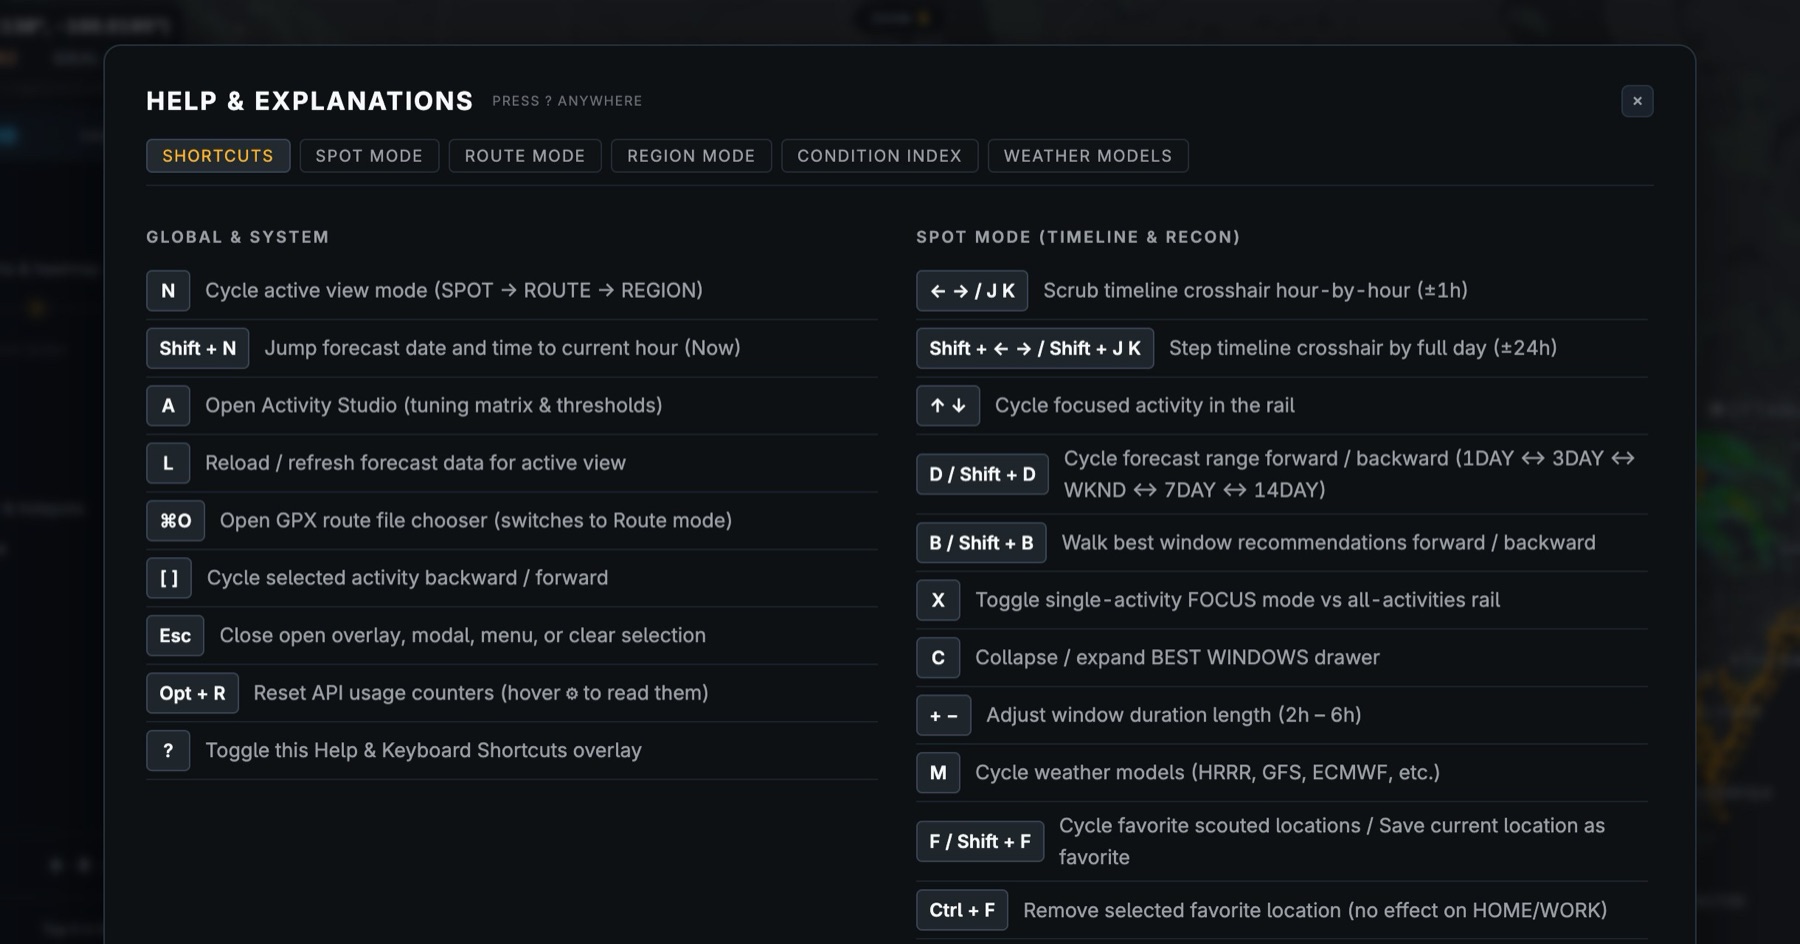
Shortcut keys and hovertips on nearly every control make it quick to learn and fun to use. It works on your phone as well, for decisions at the trailhead.

Press ? anywhere The Help and Explanations overlay listing keyboard shortcuts: N cycles views, A opens the Activity Studio, M cycles weather models, and more.

WeatherRidge

Forecasts from NOAA, Environment Canada, Météo-France, DWD and ECMWF, via Open-Meteo. Screenshots are the live app, November 2026. We don't make the weather. We just read it very carefully.